Why this dashboard matters
-
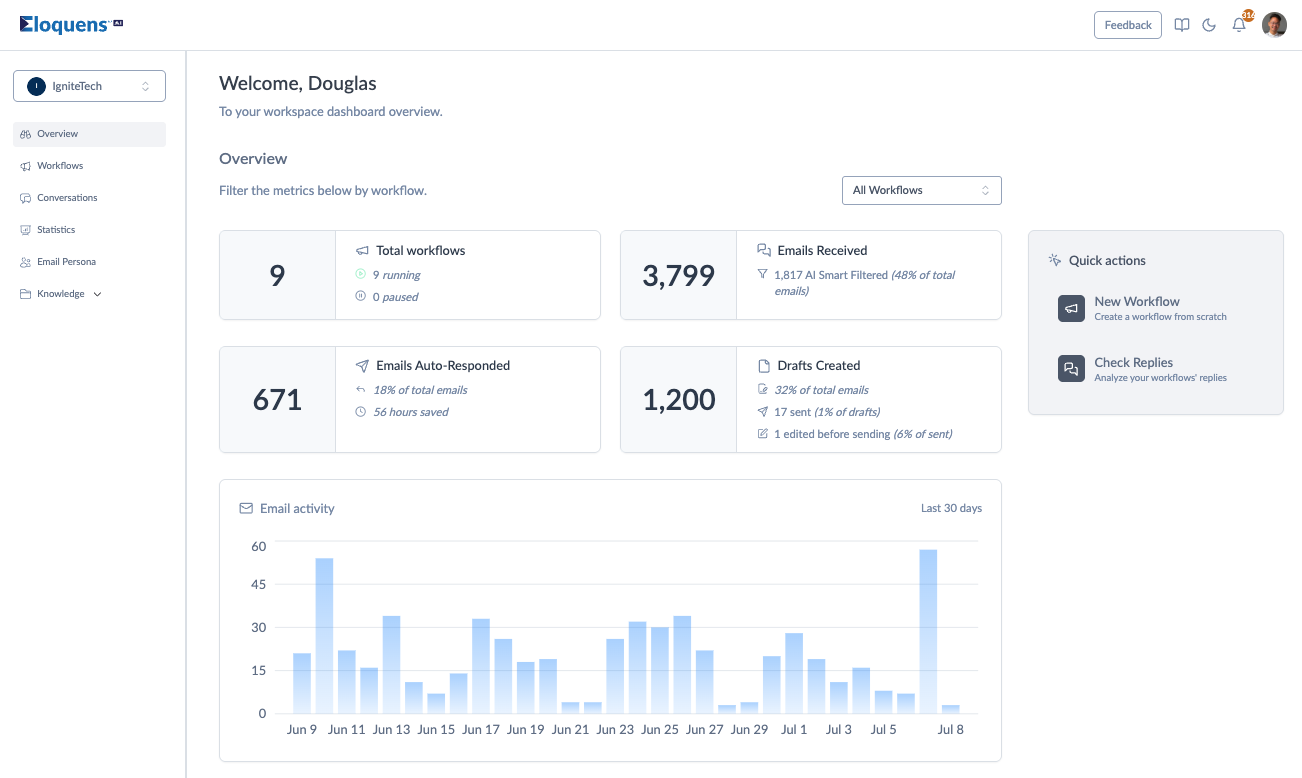
See it all at a glance. Get real‑time counts of traffic, automation, drafts, and workflows - no pivot tables required.
Spot issues early. Unusual spikes in incoming mail or dips in auto‑response rates flag themselves immediately. - Quantify ROI. The Hours saved stat translates AI effort into time back for your team.
How to access the Overview
Click Overview in the left‑hand navigation panel.
What each metric means
| Tile |
What it tells you |
Extra details/visuals |
| Total workflows |
Count of automation flows in the workspace. |
Running or Paused |
| Emails Received |
All incoming emails captured in the period |
Shows Filtered count % of Emails Filtered |
| Emails Auto‑Responded |
Messages fully answered by AI with no human drafts. |
Displays % of total emails Hours saved |
| Drafts Created |
Replies prepared for human review. |
Shows % of total emails Sent drafts (count & % of drafts) Edited drafts (count & % of drafts sent) |
You refine the view to show only metrics for a specific workflow by clicking on the "All Workflow" dropdown which will reveal all of the workflows you have.
Quick Actions panel
-
New Workflow. Launch the wizard to build a fresh automation flow.
-
Check Replies. Jump straight to the analytics view of your workflow replies.
“Take a deeper dive” chart
The bar chart under the metrics area visualises Email activity for the last 30 days. Hover any bar to see the exact count on that day.
Douglas Ho
Comments